Marketing Dashboard
Building Take into one of the biggest restaurant brands in the Eastern Region.
Last updated: 6 June 2026 · Reporting period: 31 May – 6 June 2026
A clear look at what we did, what is working, and what comes next.
One month of work. The numbers speak for themselves.
Siraj Ventures started working with Take at the end of April 2026. Compare the months before vs after.
Siraj Ventures started end of April. May is the first full month of work. Views grew nearly 7× vs April, and reach grew almost 8×. In the first 7 days of June alone, Instagram already crossed 55,545 views and 31,326 accounts reached.
Facebook tells the same story. After Siraj Ventures joined at the end of April, May views jumped to 79,285, more than 4× April and the strongest month of the year. Interactions nearly tripled from April to May.
TikTok has grown every single month since Siraj Ventures joined. May video views hit 41,100, more than 2.5× April and nearly 15× January. Likes jumped from 350 in April to 734 in May, a 109% increase in a single month.
Here is what we achieved
in the last 7 days.
From 31 May to 6 June. Nearly 100,000 views across Instagram, Facebook, and TikTok in a single week.
What Has Changed Since
Siraj Ventures Came In.
The numbers speak for themselves.
Average reel views went from 300 to over 5,000. The best reel ever went from 900 views to 40,000 views.
This happened in weeks, not months.
All of this happened in a matter of weeks. We are only just getting started.
The foundation is set. The content is working. What comes next will be even bigger.
Take's Strategy Roadmap
How we go from strong organic growth to consistent store visits and a loyal audience.
An offer so good it's impossible to say no
Add an extra patty for a single day, or push something that is heavily in demand. We will test different offers until one clicks. The goal of this offer is to bring maximum awareness, not to make revenue. All offers and hooks can only be availed at the store.
- Preliminary launch of the hook on Sunday, 28 June
- Each offering hook will be tested for one week until the winner is found
- The hook itself is the primary driver of traffic to the store and Yalla QR
- Target: hit 10,000 views consistently on every video so the organic push behind each hook is strong
Turn store visitors into a social audience
Once the hook starts producing store visits, we capture those customers on social media by getting them to follow Take. This converts a one-time visit into an ongoing audience we can market to again and again.
Scale organic content to 100k+ views consistently
With the audience growing, we raise the quality bar on organic content and layer in experience-driven campaigns that get people talking and participating.
- Run challenges, giveaways, and contests as experience-driven campaigns
- One challenge, giveaway, or contest every month
- Rinse and repeat the winning formats
- Push special campaigns around major events like national holidays
Where We Are Headed
Three simple steps that move us from posting videos to filling tables.
Keep improving what works
Better hooks, better visuals, better storytelling. Every week slightly better than the last.
Build a bigger audience in Saudi Arabia
Grow a strong base of local people who love the brand and look forward to our content.
Turn that audience into real customers
Use offers and special content made for local people to get them through the restaurant door.
This Week's Numbers
The key results from the last week in one quick view.
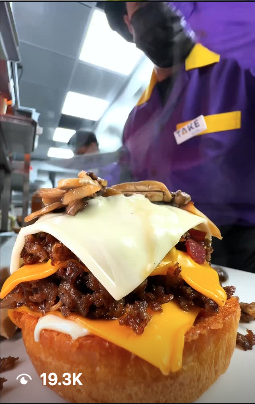
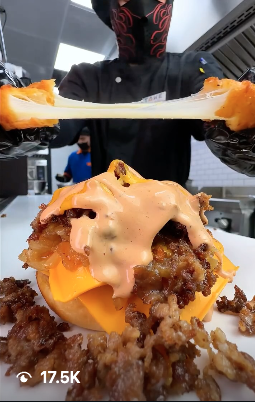
Top videos this period
The five videos that got the most views in the last 7 days.
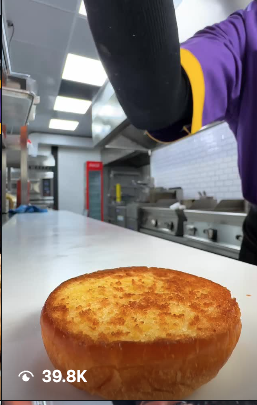
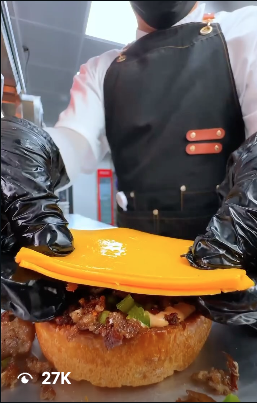
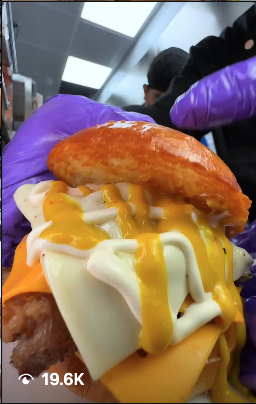
How we are growing
Instagram views and reach, April versus May 2026.
Content Calendar, June 2026
Click any date to see the plan for that day.
Sunday, 7 June 2026
5 tasks scheduled
- Research 2 videosPlanned
- Script 2 videosPlanned
- Film 2 videosPlanned
- Edit 2 videosPlanned
- Post 2 videosPlanned
If this is what the beginning looks like, imagine what the next month will bring.